Model Overview
This rainfall interception model is derived from the original Gash analytical model and the calculations of interception components are based on Link et al. (2004), who investigated the dynamics of rainfall interception processes. The Gash analytical model is a storm-based interception model assuming rainfall is a succession of discrete storms, separated by periods long enough to allow the canopy to dry completely.
Each of the discrete storms comprising three distinct phases:
(1) The canopy wetting-up from the beginning of rainfall until saturation is reached.
(2) The canopy is completely saturated.
(3) Starting at the end of the rainfall and lasting until the trunks and the canopy are completely dry.
Each of the discrete storms comprising three distinct phases:
(1) The canopy wetting-up from the beginning of rainfall until saturation is reached.
(2) The canopy is completely saturated.
(3) Starting at the end of the rainfall and lasting until the trunks and the canopy are completely dry.
A full list of glossary will help as you keep reading!
Download the list of glossary
Download the list of glossary
Theory
By definition, interception is the part of rain that falls on the vegetation and evaporates without reaching the ground, and was expressed as equation (1):
I = P - T (1)
where I is the interception (mm), P is precipitation (mm), and T is the throughfall and stemflow (mm), which equals to rainfall underneath or inside the canopy (Klaasen et al., 1995).
When rainfall begins, throughfall (T; in mm) is part of rainfall that directly reaches the ground without touching the leaves and branches. The amount of direct T reaching the floor is represented by a free throughfall coefficient (p). T will increase approximately linearly with precipitation (PG; in mm) at a constant rate <1, until the canopy is saturated (i.e. Direct Throughfall Regression in Figure 1).
The remaining part (1- p) may be temporarily stored on the canopy, evaporated into the atmosphere (E; in mm/h) or drained to the forest floor (D; in mm/h). Once the accumulated precipitation required to saturate the canopy (Pg) is reached, the slope of the T-PG is larger than before saturation (i.e. Saturation Regression in Figure 1) but still <1, because evaporation is occurring during the rainfall; otherwise, the slope will be unity if there is no evaporation.
By plotting the relationship between T and PG, major parameters of the model: evaporate rate and rainfall rate ratio (E/R), free throughfall coefficient (p), and crown saturation storage (S) may be estimated from Figure 1. The p is the slope of direct throughfall regression, E/R is determined by the slope of saturation regression, and S is determined by the intercept of the saturation regression. This T-PG plot approach requires adequate throughfall data to generate the plot. For this study, different approaches were applied in obtaining these parameters without measuring throughfall, as one of the purposes for modelling rainfall interception is to avoid some field measurements.
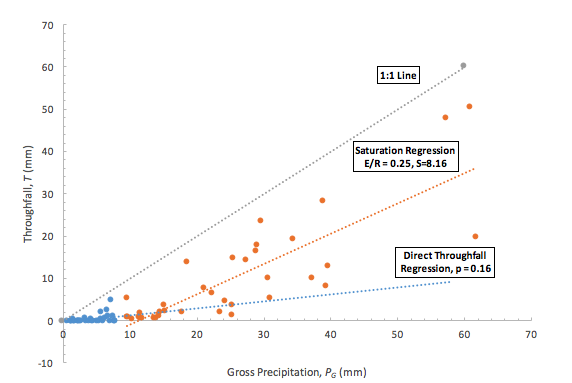
Figure 1. Example plot of data used to determine canopy direct throughfall proportion and saturation storage capacity, and evaporation rate over rainfall rate ratio (Note: Data applied is the throughfall of a single Douglas-fir tree (Asadian and Weiler, 2009)).
Derivation of Parameters
When no throughfall measurement were made, the following approach may be used to obtain each of the parameters:
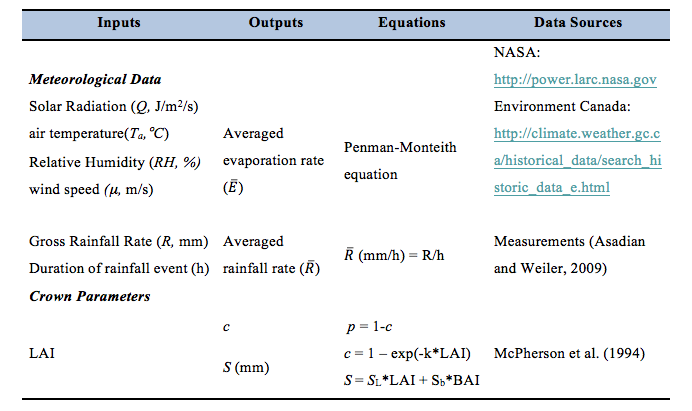
The mean evaporation rate was calculated using Penman-Monteith equation with sufficient inputs of meteorological data. Specifically, daily air temperature, relative humidity, wind speed (during the study period of December 2007 and November 2008 were obtained from Environment Canada) and daily net solar radiation for the same period was obtained from NASA (Prediction of Worldwide Energy Resource). The rainfall event data, including total rainfall and duration over the study period, were obtained from Asadian and Weiler (2009), who used tipping buckets rain gauges to measure the rainfall and throughfall of urban trees in the District of North Vancouver. The average rainfall rate (R) was then calculated by dividing gross precipitation by the duration of the rainfall event.
The two canopy parameters p and S were estimated using leaf area index (LAI) of specific tree species. For the seasonal variation, it was assumed that LAI for deciduous species reaches maximum during the summer, minimum during winter (dominated by stems and branches), and experiences the transition process between leaf-on and leaf-off during spring and fall, respectively. The influences of parameters derived from different approaches on the model are presented in the Model Performance.
Table 1. Summary of data inputs
Interception Calculation
The calculations of interception components were separated based on the magnitude of rainfall events (i.e. the mean amount of rainfall required to saturate the canopy (Pg):
For m small storms insufficient to saturate the canopy (i.e. PG < Pg), the amount of interception is (Ic).
For n large storms sufficient to saturate the canopy (i.e. PG >= Pg), there are three stages of interception involved:
Thus, the total net interception loss is:
Inet = Ic + Iw + Is + Ia
For m small storms insufficient to saturate the canopy (i.e. PG < Pg), the amount of interception is (Ic).
For n large storms sufficient to saturate the canopy (i.e. PG >= Pg), there are three stages of interception involved:
- Interception (Iw) during wetting up of the canopy (i.e. before saturation)
- Evaporation during canopy saturation (Is)
- Evaporation after rainfall ceases(Ia) (assuming no dripping after the rain stops)
Thus, the total net interception loss is:
Inet = Ic + Iw + Is + Ia
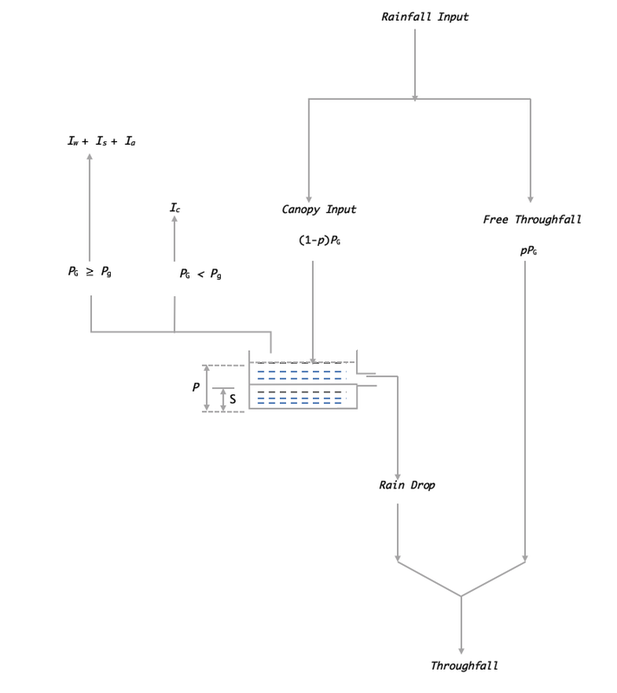
Figure 2. The conceptual framework of the interception components in this model
Please see the Full Report for details of Model Theory, Parameters Derivation, and Interception Calculations
