Model Application
Species Selection
To see how the interception performance varies among deciduous trees, it would be preferable to test it against the tree species that are grown in local municipalities. However, the throughfall data for interested species is not available in this study to allow the estimation of E/R using T-PG method. Thus, the Penman-Monteith estimated E/R was used for this test. The tree selection was determined by a simple survey conducted among several local municipalities, namely the District of North Vancouver, the District of Kent, the City North Vancouver, the City of Maple Ridge, the City of Surrey, the City of Coquitlam, the City of Port Moody, and the Township of Langley. White Oak (Quercu alba L.), Norway maple (Acer platanoides L.), Green ash (Fraxinus pennsylvanica Marsh.), and Prunus spp. are among the most common planted street tree species in these urban areas, and were thus selected for the rainfall interception model.
Map of local municipalities (blue markers) included in the simple survey. Red marker indicates the District of North Vancouver
Seasonal Rainfall Interception Performance
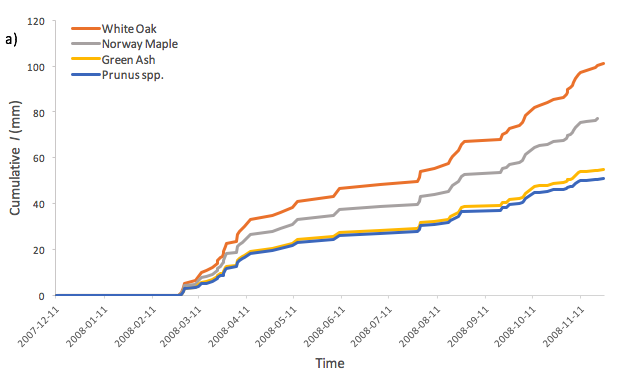
Figure 5a demonstrates the results of the modelled interception loss of four selected deciduous species. Because all four selected species were assumed to lose their leaves during winter, the storage of the trees was dominated by stem and branches. Thus the rainfall interception performances are the same for all selected species (Figure 5a). The cumulative rainfall intercepted by each species diverged in March and April. Among the four species, White oak presented the highest capacity of interception through the whole study period, followed by Norway maple, Green ash, and Prunus spp., and only minimum differences were observed between Green ash and Prunus spp.
Differences in water storage capacities among these species reflected the differences in the morphogenesis of leaf surfaces, which influence the surface water storage, by affecting the amount of throughfall and drop-size (Xiao et al., 2016). Other factor varied among species, such as leaf hydrophobicity, roughness, geometry, inclination, which are also considered to have impacts on the water storage capacity on leaves surface (Nanko et al., 2006, 2013).
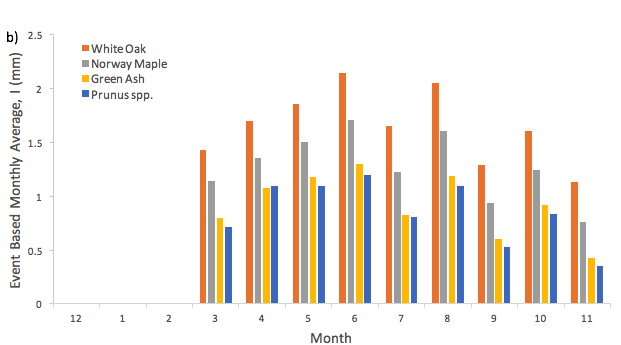
Figure 5b shows averaged interception loss, per event, on a monthly basis for each species. All four species present similar monthly pattern of interception capacity. In general, a high peak for all species was observed in summer months, and the lowest interception loss was observed in the winter months, where only minor rainfall was intercepted by the stem and the branches for all species. High interception loss per rainfall event during summer could be explained by the high evaporation rate controlled by the air temperature. The amount of rainfall received in fall and winter in Vancouver area are high, consequently leading to more significant variations of rainfall rate compared to that in spring and summer.
Differences in water storage capacities among these species reflected the differences in the morphogenesis of leaf surfaces, which influence the surface water storage, by affecting the amount of throughfall and drop-size (Xiao et al., 2016). Other factor varied among species, such as leaf hydrophobicity, roughness, geometry, inclination, which are also considered to have impacts on the water storage capacity on leaves surface (Nanko et al., 2006, 2013).
Figure 5b shows averaged interception loss, per event, on a monthly basis for each species. All four species present similar monthly pattern of interception capacity. In general, a high peak for all species was observed in summer months, and the lowest interception loss was observed in the winter months, where only minor rainfall was intercepted by the stem and the branches for all species. High interception loss per rainfall event during summer could be explained by the high evaporation rate controlled by the air temperature. The amount of rainfall received in fall and winter in Vancouver area are high, consequently leading to more significant variations of rainfall rate compared to that in spring and summer.
|
|
Figure 5. Seasonal interception loss of four species: a) cumulative sum of interception loss; b) monthly averaged interception for each event.
For more details please download the Full Report
