Model Performance
Before testing the model on species of interest, it was validated by comparing the results of modelled throughfall with actual measured through fall data from previous study. The model was applied on an event basis using both T-PG estimated E/R, and the Penman-Monteith equation estimated E/R (See Model Overview).
The throughfall data for species of interest in this study was not available, thus throughfall data for one single Douglas-fir (Pseudotsuga menziesii) and one single Western red cedar (Thuja plicata) was used as measured by Asadian and Weiler (2009) over a one-year period were applied. The interception loss for each of Douglas-fir and Western red cedar was obtained by applying the same method of calculation described in Interception Calculations. The modelled throughfall were then obtained by applying Equation (1).
Figure 3a and Figure 3b show the comparison between two approaches of modelled throughfall and measured throughfall for a single tree of Western red cedar and Douglas-fir, respectively. Overall, the model performs relatively well, and the difference between two E/R estimation approaches is minimum. The model slightly overestimates the throughfall (i.e. underestimating the interception) for both applied approaches. Nevertheless, the pattern of modelled and measured throughfall mimics each other well (Figure 3a; 3b).
E/R estimated through T-PG plot shows less overestimation on throughfall compared to Penman-Monteith estimated E/R. For both species, the modelled and measured data start diverging in the month of April. In the month of October, the modelled and measured data for Douglas-fir starts merging, while the difference between modelled and measured data increases in the case of Western Red Cedar.
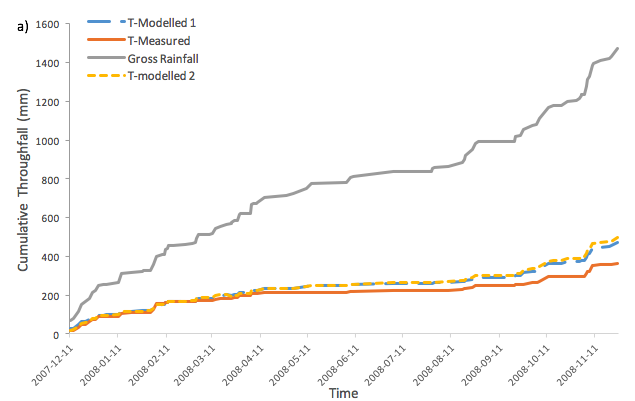
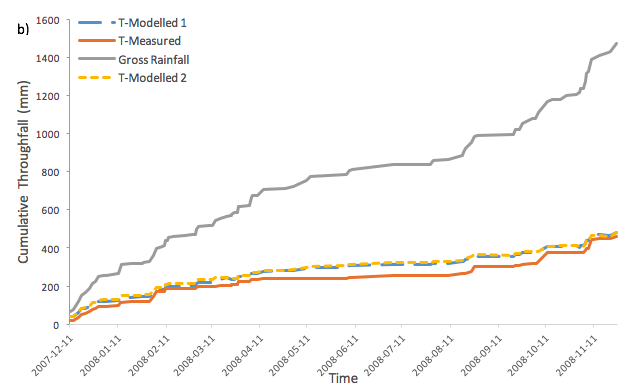
Figure 3. Cumulative rainfall (PG) and throughfall (T) for two species: a) Western Red Cedar (WRC); b) Douglas Fir (DF). Both measured and modelled throughfall are presented (T-modelled 1: T-PG estimated E/R; T-modelled 2: Penman-Monteith equation estimated E/R).
For more details please download the Full Report
